Technical Analysis / Candlesticks
Doji candlesticks: watching for a change in direction
What does a Doji candlestick tell us about market indecision? Bodies, wicks, and the main variations, illustrated with chart examples.

What is a Doji candlestick?
It has a small body.
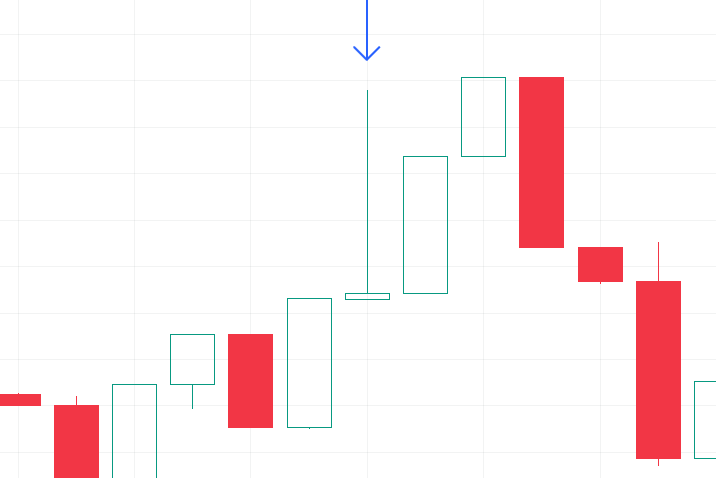
A Doji on the chart indicates market indecision at that moment. Sellers and buyers are trading around the same price levels, leaving the candle with a very small body.
For example, on a chart with five-minute candles (M5), the Doji’s opening and closing prices over those five minutes are almost the same.
The wicks make up almost the entire candle.
A Doji’s wicks can vary in length depending on price movements and volatility during the selected period. Their length relative to the body provides information about the strength of those movements and the possibility of a change in market direction (reversal).
What should we look for when a Doji appears?
The length of its wicks
The upper and lower wicks show the range between the highest and lowest prices reached during that period. Their lengths vary, producing the different forms described below.
The candles before and after it
A Doji alone cannot tell us whether the trend will continue. We need to read the preceding and following candles to better understand why it formed and whether it represents a valid reversal, or simply a white flag between bulls and bears.
Where it forms on the chart
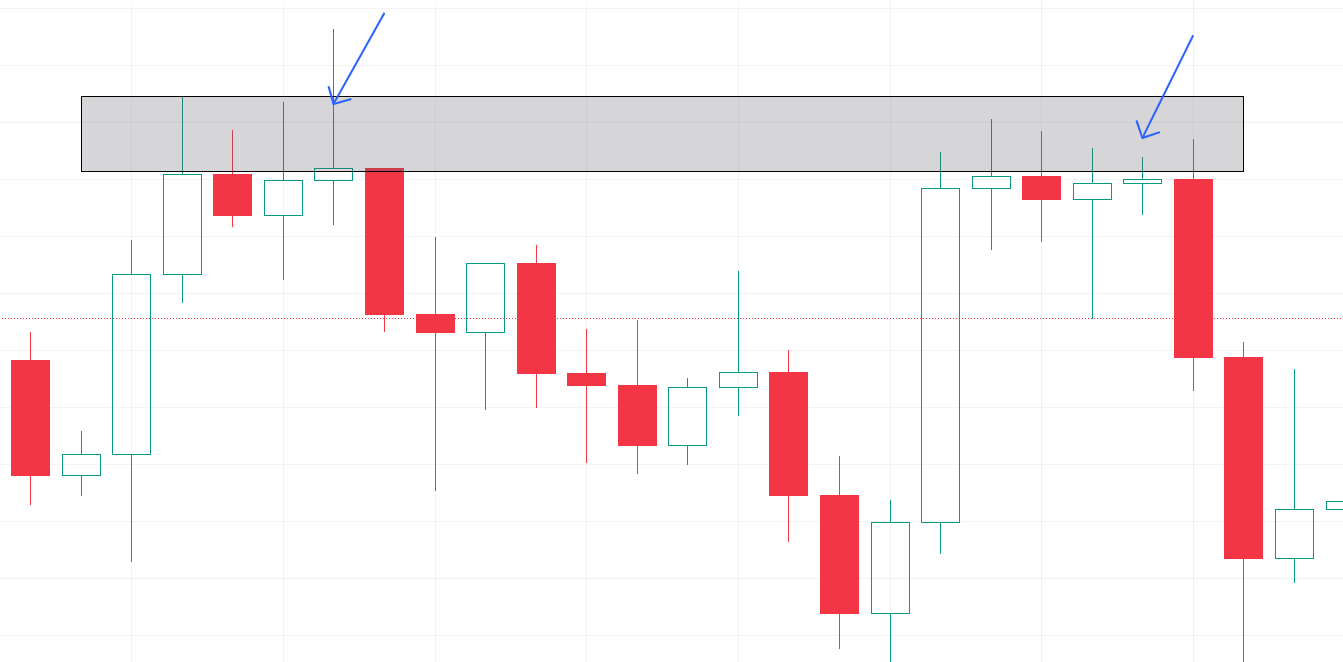
- Perhaps the most important thing to observe is where the Doji forms. A Doji at a key level may signal a change in direction.
For example, a Doji at a resistance level may suggest that the trend is about to change.
Doji variations
-
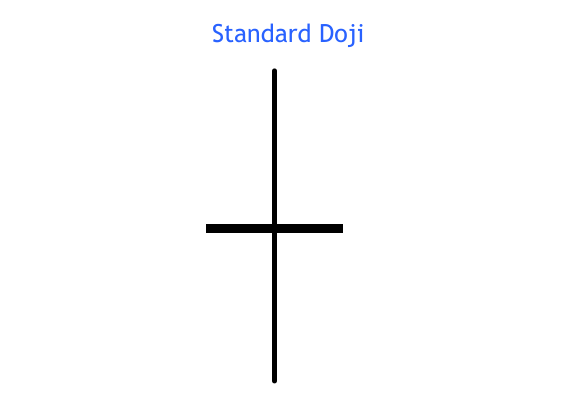
Standard Doji
A standard Doji has identical or almost identical opening and closing prices, leaving a very small or nonexistent body.
-
Long-legged Doji
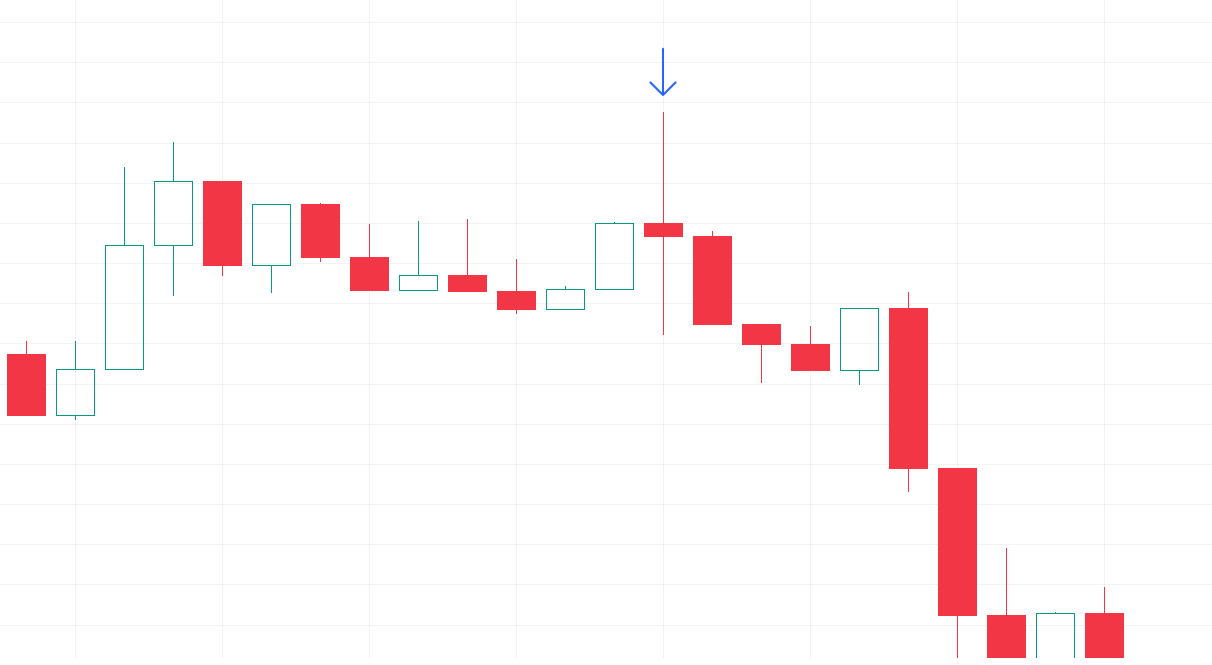
A Long-legged Doji has long wicks both above and below the candle’s body, indicating substantial volatility.
Initially, sellers pushed the price lower, but buyers absorbed the decline and even drove it higher. Despite that, sellers brought the price back to its opening level.
-
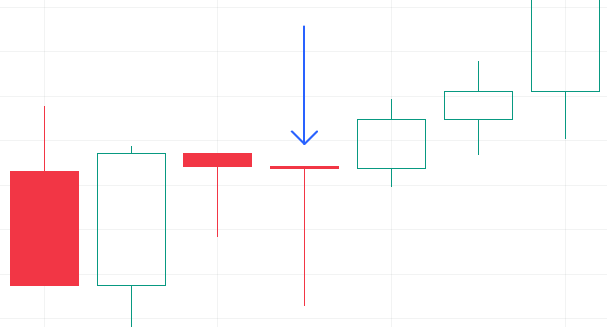
Dragonfly Doji
A Dragonfly Doji has its wick below the candle’s body. Selling pressure drove the price lower, but the candle did not close above its opening price.
Sellers initially pushed the price down. Buyers then held the price and recovered the decline, but did not drive it above the opening level.
-
Gravestone Doji
A Gravestone Doji has its wick above the candle’s body. The price rose above the opening level, but sellers took control and brought it back to the opening price without pushing it lower.
This is the opposite of the Dragonfly Doji.